
geovista.geoplotter#
Provide specialisation to support a geospatial aware plotter.
See pyvista.Plotter.
Notes#
Added in version 0.1.0.
Attributes#
The valid 'style' options for adding points. |
|
Proportional multiplier for z-axis levels/offsets of base-layer mesh. |
|
Coastlines relative tolerance for longitudes close to 'wrap meridian'. |
|
The default font size for graticule labels. |
|
Whether to render graticule labels by default. |
|
Known GPU renderer and version combinations that don't support opacity. |
Classes#
A geospatial aware plotter. |
|
Base class with common behaviour for a geospatial aware plotter. |
Module Contents#
- class geovista.geoplotter.GeoPlotter(*args, crs=None, manifold=None, theme=None, **kwargs)[source]#
Bases:
GeoPlotterBase,pvA geospatial aware plotter.
See
geovista.geoplotter.GeoPlotterBaseandpyvista.Plotter.Notes#
Added in version 0.1.0.
Create geospatial aware plotter.
- Parameters:
- *args
tuple, optional See
pyvista.Plotterfor further details.- crs
CRSLike, optional The target CRS to render geolocated meshes added to the plotter. May be anything accepted by
pyproj.crs.CRS.from_user_input(). Defaults toEPSG:4326i.e.,WGS 84.- manifold
BBox, optional Apply the manifold to each mesh added to the plotter so that only the region enclosed by the manifold is rendered.
- theme
Themeorstr, optional Plot specific theme.
- **kwargs
dict, optional See
pyvista.Plotterfor further details.
- *args
Notes
Added in version 0.1.0.
- class geovista.geoplotter.GeoPlotterBase(*args, crs=None, manifold=None, theme=None, **kwargs)[source]#
Base class with common behaviour for a geospatial aware plotter.
See
pyvista.Plotter.Notes#
Added in version 0.1.0.
Create geospatial aware plotter.
- Parameters:
- *args
tuple, optional See
pyvista.Plotterfor further details.- crs
CRSLike, optional The target CRS to render geolocated meshes added to the plotter. May be anything accepted by
pyproj.crs.CRS.from_user_input(). Defaults toEPSG:4326i.e.,WGS 84.- manifold
BBox, optional Apply the manifold to each mesh added to the plotter so that only the region enclosed by the manifold is rendered.
- theme
Themeorstr, optional Plot specific theme.
- **kwargs
dict, optional See
pyvista.Plotterfor further details.
- *args
Notes
Added in version 0.1.0.
- add_base_layer(*, mesh=None, resolution=None, radius=None, zlevel=None, zscale=None, rtol=None, atol=None, **kwargs)[source]#
Generate a cubed-sphere base layer mesh and add to the plotter scene.
Optionally, a mesh may be provided (e.g. if one is available that better fits the geometry of the surface mesh).
- Parameters:
- mesh
PolyData, optional Use the provided mesh as the base layer.
- resolution
str, optional The resolution of the cubed-sphere to generate as the base layer, which may be either
c48,c96orc192. Defaults togeovista.pantry.meshes.LFRIC_RESOLUTION. Alternatively, generate a regular grid using a format ofrN, whereNis the number of cells in latitude, andN * 1.5cells in longitude. When adding a base layer to a projection, the default is to use a regular grid with resolutiongeovista.pantry.meshes.REGULAR_RESOLUTION.- radius
float, optional The radius of the spherical mesh to generate as the base layer. Defaults to
geovista.common.RADIUS.- zlevel
int, optional The z-axis level. Used in combination with the zscale to offset the radius by a proportional amount i.e.,
radius * zlevel * zscale. Defaults to-1.- zscale
float, optional The proportional multiplier for z-axis zlevel. Defaults to
BASE_ZLEVEL_SCALE.- rtol
float, optional The relative tolerance for longitudes close to the ‘wrap meridian’ - see
geovista.common.wrap()for more.- atol
float, optional The absolute tolerance for longitudes close to the ‘wrap meridian’ - see
geovista.common.wrap()for more.- **kwargs
dict, optional
- mesh
- Returns:
ActorThe rendered actor added to the plotter scene.
Notes
Added in version 0.1.0.
- add_coastlines(*, resolution=None, radius=None, zlevel=None, zscale=None, rtol=None, atol=None, **kwargs)[source]#
Generate coastlines and add to the plotter scene.
- Parameters:
- resolution
str, optional The resolution of the Natural Earth coastlines, which may be either
110m,50m, or10m. Defaults togeovista.common.COASTLINES_RESOLUTION.- radius
float, optional The radius of the sphere. Defaults to
geovista.common.RADIUS.- zlevel
int, optional The z-axis level. Used in combination with the zscale to offset the radius by a proportional amount i.e.,
radius * zlevel * zscale. Defaults togeovista.common.ZTRANSFORM_FACTOR.- zscale
float, optional The proportional multiplier for z-axis zlevel. Defaults to
geovista.common.ZLEVEL_SCALE.- rtol
float, optional The relative tolerance for longitudes close to the ‘wrap meridian’ - see
geovista.common.wrap()for more.- atol
float, optional The absolute tolerance for longitudes close to the ‘wrap meridian’ - see
geovista.common.wrap()for more.- **kwargs
dict, optional
- resolution
- Returns:
ActorThe rendered actor added to the plotter scene.
Notes
Added in version 0.1.0.
- add_graticule(*, lon_start=None, lon_stop=None, lon_step=None, lat_start=None, lat_stop=None, lat_step=None, n_samples=None, factor=None, poles_parallel=None, poles_label=None, show_labels=None, radius=None, zlevel=None, zscale=None, mesh_args=None, point_labels_args=None, name=None)[source]#
Generate a graticule and add to the plotter scene.
This involves generating lines of constant latitude (parallels) and lines of constant longitude (meridians), which together form the graticule.
- Parameters:
- lon_start
float, optional The first line of longitude (degrees). The graticule will include this meridian. Defaults to
geovista.gridlines.LONGITUDE_START.- lon_stop
float, optional The last line of longitude (degrees). The graticule will include this meridian when it is a multiple of lon_step. Also see
closed_intervalincreate_meridians(). Defaults togeovista.gridlines.LONGITUDE_STOP.- lon_step
float, optional The delta (degrees) between neighbouring meridians. Defaults to
geovista.gridlines.LONGITUDE_STEP.- lat_start
float, optional The first line of latitude (degrees). The graticule will include this parallel. Also see poles_parallel. Defaults to
geovista.gridlines.LATITUDE_START.- lat_stop
float, optional The last line of latitude (degrees). The graticule will include this parallel when it is a multiple of lat_step. Defaults to
geovista.gridlines.LATITUDE_STOP.- lat_step
float, optional The delta (degrees) between neighbouring parallels. Defaults to
geovista.gridlines.LATITUDE_STEP.- n_samples
int|tuple[int|None,int|None], optional The number of points in a single line of longitude and latitude. If a single integer is provided, both meridians and parallels will use that value. If a tuple of two integers is provided, the first value will be used for meridians and the second for parallels. A value of
Nonewill use the defaults provided bygeovista.gridlines.LONGITUDE_N_SAMPLESandgeovista.gridlines.LATITUDE_N_SAMPLES.- factor
float, optional The factor to scale the number of sample points in a single graticule line (meridians and parallels) e.g. a
factor=2will double the number of sample points. Defaults to1.- poles_parallel
bool, optional Whether to create a line of latitude at the north/south poles. Defaults to
geovista.gridlines.LATITUDE_POLES_PARALLEL.- poles_label
bool, optional Whether to create a single north/south pole label. Only applies when
poles_parallel=False. Defaults togeovista.gridlines.LATITUDE_POLES_LABEL.- show_labels
bool, optional Whether to render the labels of the parallels and meridians. Defaults to
GRATICULE_SHOW_LABELS.- radius
float, optional The radius of the sphere. Defaults to
geovista.common.RADIUS.- zlevel
int, optional The z-axis level. Used in combination with the zscale to offset the radius by a proportional amount i.e.,
radius * zlevel * zscale. Defaults togeovista.gridlines.GRATICULE_ZLEVEL.- zscale
float, optional The proportional multiplier for z-axis zlevel. Defaults to
geovista.common.ZLEVEL_SCALE.- mesh_args
dict, optional Arguments to pass through to
pyvista.Plotter.add_mesh().- point_labels_args
dict, optional Arguments to pass through to
pyvista.Plotter.add_point_labels().- name
str, optional The name for the added graticule actors so that they can be easily updated. If actors of this name already exist in the plotter scene, they will be replaced by the new actors. Note that the provided name will be prepended with
meridian-orparallel-to form the names of the graticule actors.
- lon_start
Notes
Added in version 0.3.0.
- add_meridian(lon, /, *, lat_step=None, n_samples=None, factor=None, show_labels=None, radius=None, zlevel=None, zscale=None, mesh_args=None, point_labels_args=None, name=None)[source]#
Generate a line of constant longitude and add to the plotter scene.
- Parameters:
- lon
float The constant line of longitude (degrees) to generate.
- lat_step
float, optional The delta (degrees) between neighbouring parallels. Sets the frequency of the labels. Defaults to
geovista.gridlines.LATITUDE_STEP.- n_samples
int, optional The number of points in a single line of longitude. Defaults to
geovista.gridlines.LONGITUDE_N_SAMPLES.- factor
float, optional The factor to scale the number of sample points in a single line of longitude e.g., a
factor=2will double the number of sample points. Defaults to1.- show_labels
bool, optional Whether to render the meridian label. Defaults to
GRATICULE_SHOW_LABELS.- radius
float, optional The radius of the sphere. Defaults to
geovista.common.RADIUS.- zlevel
int, optional The z-axis level. Used in combination with the zscale to offset the radius by a proportional amount i.e.,
radius * zlevel * zscale. Defaults togeovista.gridlines.GRATICULE_ZLEVEL.- zscale
float, optional The proportional multiplier for z-axis zlevel. Defaults to
geovista.common.ZLEVEL_SCALE.- mesh_args
dict, optional Arguments to pass through to
pyvista.Plotter.add_mesh().- point_labels_args
dict, optional Arguments to pass through to
pyvista.Plotter.add_point_labels().- name
str, optional The name for the added meridian/actors so that it can be easily updated. If an actor of this name already exists in the plotter scene, it will be replaced by the new actor. Note that the provided name will be prepended with
meridian-along with the longitude to form the name of the added meridian/actors.
- lon
Notes
Added in version 0.3.0.
- add_meridians(*, start=None, stop=None, step=None, lat_step=None, n_samples=None, factor=None, show_labels=None, radius=None, zlevel=None, zscale=None, mesh_args=None, point_labels_args=None, name=None)[source]#
Generate lines of constant longitude and add to the plotter scene.
- Parameters:
- start
float, optional The first line of longitude (degrees). The graticule will include this meridian. Defaults to
geovista.gridlines.LONGITUDE_START.- stop
float, optional The last line of longitude (degrees). The graticule will include this meridian when it is a multiple of step. Also see
closed_intervalincreate_meridians(). Defaults togeovista.gridlines.LONGITUDE_STOP.- step
float, optional The delta (degrees) between neighbouring meridians. Defaults to
geovista.gridlines.LONGITUDE_STEP.- lat_step
float, optional The delta (degrees) between neighbouring parallels. Sets the frequency of the labels. Defaults to
geovista.gridlines.LATITUDE_STEP.- n_samples
int, optional The number of points in a single line of longitude. Defaults to
geovista.gridlines.LONGITUDE_N_SAMPLES.- factor
float, optional The factor to scale the number of sample points in a single line of longitude e.g., a
factor=2will double the number of sample points. Defaults to1.- show_labels
bool, optional Whether to render the labels of the meridians. Defaults to
GRATICULE_SHOW_LABELS.- radius
float, optional The radius of the sphere. Defaults to
geovista.common.RADIUS.- zlevel
int, optional The z-axis level. Used in combination with the zscale to offset the radius by a proportional amount i.e.,
radius * zlevel * zscale. Defaults togeovista.gridlines.GRATICULE_ZLEVEL.- zscale
float, optional The proportional multiplier for z-axis zlevel. Defaults to
geovista.common.ZLEVEL_SCALE.- mesh_args
dict, optional Arguments to pass through to
pyvista.Plotter.add_mesh().- point_labels_args
dict, optional Arguments to pass through to
pyvista.Plotter.add_point_labels().- name
str, optional The name for the added meridians/actors so that it can be easily updated. If an actor of this name already exists in the plotter scene, it will be replaced by the new actor. Note that the provided name will be prepended with
meridian-along with the longitude to form the name of the added meridians/actors.
- start
Notes
Added in version 0.3.0.
- add_mesh(mesh, /, *, radius=None, zlevel=None, zscale=None, rtol=None, atol=None, **kwargs)[source]#
Add the mesh to the plotter scene.
See
pyvista.Plotter.add_mesh().- Parameters:
- mesh
PolyData The mesh to add to the plotter.
- radius
float, optional The radius of the sphere. Defaults to
geovista.common.RADIUS.- zlevel
intorArrayLike, optional The z-axis level. Used in combination with the zscale to offset the radius/vertical by a proportional amount e.g.,
radius * zlevel * zscale. If zlevel is not a scalar, then its shape must match or broadcast with the shape of themesh.points. Defaults to0.- zscale
float, optional The proportional multiplier for z-axis zlevel. Defaults to
geovista.common.ZLEVEL_SCALE.- rtol
float, optional The relative tolerance for longitudes close to the ‘wrap meridian’ - see
geovista.common.wrap()for more.- atol
float, optional The absolute tolerance for longitudes close to the ‘wrap meridian’ - see
geovista.common.wrap()for more.- **kwargs
dict, optional
- mesh
- Returns:
ActorThe rendered actor added to the plotter scene.
Notes
Added in version 0.1.0.
- add_parallel(lat, /, *, lon_step=None, n_samples=None, factor=None, poles_parallel=None, show_labels=None, radius=None, zlevel=None, zscale=None, mesh_args=None, point_labels_args=None, name=None)[source]#
Generate a line of constant latitude and add to the plotter scene.
- Parameters:
- lat
float The constant line of latitude (degrees) to generate.
- lon_step
float, optional The delta (degrees) between neighbouring meridians. Sets the frequency of the labels. Defaults to
geovista.gridlines.LONGITUDE_STEP.- n_samples
int, optional The number of points in a single line of latitude. Defaults to
geovista.gridlines.LATITUDE_N_SAMPLES.- factor
float, optional The factor to scale the number of sample points in a single line of latitude e.g., a
factor=2will double the number of sample points. Defaults to1.- poles_parallel
bool, optional Whether to create a line of latitude at the north/south poles. Defaults to
geovista.gridlines.LATITUDE_POLES_PARALLEL.- show_labels
bool, optional Whether to render the parallel label. Defaults to
GRATICULE_SHOW_LABELS.- radius
float, optional The radius of the sphere. Defaults to
geovista.common.RADIUS.- zlevel
int, optional The z-axis level. Used in combination with the zscale to offset the radius by a proportional amount i.e.,
radius * zlevel * zscale. Defaults togeovista.gridlines.GRATICULE_ZLEVEL.- zscale
float, optional The proportional multiplier for z-axis zlevel. Defaults to
geovista.common.ZLEVEL_SCALE.- mesh_args
dict, optional Arguments to pass through to
pyvista.Plotter.add_mesh().- point_labels_args
dict, optional Arguments to pass through to
pyvista.Plotter.add_point_labels().- name
str, optional The name for the added parallel/actor so that it can be easily updated. If an actor of this name already exists in the plotter scene, it will be replaced by the new actor. Note that the provided name will be prepended with
parallel-along with the latitude to form the name of the added parallel/actor.
- lat
Notes
Added in version 0.3.0.
- add_parallels(*, start=None, stop=None, step=None, lon_step=None, n_samples=None, factor=None, poles_parallel=None, poles_label=None, show_labels=None, radius=None, zlevel=None, zscale=None, mesh_args=None, point_labels_args=None, name=None)[source]#
Generate lines of constant latitude and add to the plotter scene.
- Parameters:
- start
float, optional The first line of latitude (degrees). The graticule will include this parallel. Also see poles_parallel. Defaults to
geovista.gridlines.LATITUDE_START.- stop
float, optional The last line of latitude (degrees). The graticule will include this parallel when it is a multiple of step. Also see poles_parallel. Defaults to
geovista.gridlines.LATITUDE_STOP.- step
float, optional The delta (degrees) between neighbouring parallels. Defaults to
geovista.gridlines.LATITUDE_STEP.- lon_step
float, optional The delta (degrees) between neighbouring meridians. Sets the frequency of the labels. Defaults to
geovista.gridlines.LONGITUDE_STEP.- n_samples
int, optional The number of points in a single line of latitude. Defaults to
geovista.gridlines.LATITUDE_N_SAMPLES.- factor
float, optional The factor to scale the number of sample points in a single line of latitude e.g., a
factor=2will double the number of sample points. Defaults to1.- poles_parallel
bool, optional Whether to create a line of latitude at the north/south poles. Defaults to
geovista.gridlines.LATITUDE_POLES_PARALLEL.- poles_label
bool, optional Whether to create a single north/south pole label. Only applies when
poles_parallel=False. Defaults togeovista.gridlines.LATITUDE_POLES_LABEL.- show_labels
bool, optional Whether to render the labels of the parallels. Defaults to
GRATICULE_SHOW_LABELS.- radius
float, optional The radius of the sphere. Defaults to
geovista.common.RADIUS.- zlevel
int, optional The z-axis level. Used in combination with the zscale to offset the radius by a proportional amount i.e.,
radius * zlevel * zscale. Defaults togeovista.gridlines.GRATICULE_ZLEVEL.- zscale
float, optional The proportional multiplier for z-axis zlevel. Defaults to
geovista.common.ZLEVEL_SCALE.- mesh_args
dict, optional Arguments to pass through to
pyvista.Plotter.add_mesh().- point_labels_args
dict, optional Arguments to pass through to
pyvista.Plotter.add_point_labels().- name
str, optional The name for the added parallels/actors so that it can be easily updated. If an actor of this name already exists in the plotter scene, it will be replaced by the new actor. Note that the provided name will be prepended with
-parallelalong with the latitude to form the name of the added parallels/actors.
- start
Notes
Added in version 0.3.0.
- add_points(points=None, *, xs=None, ys=None, scalars=None, crs=None, radius=None, style=None, zlevel=None, zscale=None, **kwargs)[source]#
Add points to the plotter scene.
See
pyvista.Plotter.add_points().- Parameters:
- points
ArrayLikeorPolyData, optional Array of xyz points, or the points of the mesh to be rendered. Passed to
pyvista.wrap()without any cartographic transformation, i.e.0 0 0is centre of the globe (the plot origin),0 0 1is the north pole.- xs
ArrayLike, optional A 1D, 2D or 3D array of point-cloud x-values, in canonical crs units. Must have the same shape as the ys.
- ys
ArrayLike A 1D, 2D or 3D array of point-cloud y-values, in canonical crs units. Must have the same shape as the xs.
- scalars
strorArrayLike, optional Values used to color the points. Either, the string name of an array that is present on the points mesh or an array equal to the number of points. If both color (see kwargs) and scalars are
None, then the active scalars on the points mesh are used.- crs
CRSLike, optional The Coordinate Reference System of the provided points, or xs and ys. May be anything accepted by
pyproj.crs.CRS.from_user_input(). Defaults toEPSG:4326i.e.,WGS 84.- radius
float, optional The radius of the mesh point-cloud. Defaults to
geovista.common.RADIUS.- style
str, optional Visualization style of the points to be rendered. May be either
pointsorpoints_gaussian. Thepoints_gaussianoption may be controlled with theemissiveandrender_points_as_spheresoptions in kwargs.- zlevel
intorArrayLike, optional The z-axis level. Used in combination with the zscale to offset the radius by a proportional amount i.e.,
radius * zlevel * zscale. If zlevel is not a scalar, then its shape must match or broadcast with the shape of the xs and ys. Defaults to0.- zscale
float, optional The proportional multiplier for z-axis zlevel. Defaults to
geovista.common.ZLEVEL_SCALE.- **kwargs
dict, optional
- points
- Returns:
ActorThe rendered actor added to the plotter scene.
Notes
Added in version 0.4.0.
- view_poi(x=None, y=None, *, crs=None)[source]#
Center the camera at a point-of-interest (POI).
If no POI is provided, then the center of the previous mesh added to the scene is used, if available.
Note that the camera will be positioned at the POI to view all the actors added to the scene so far; order is important. The point at which
view_poi()is called relative to the other actors influences the final rendered scene.- Parameters:
- x
float, optional The spatial x-value point, in canonical crs units, of the POI. Defaults to
0if unspecified and y has been provided, otherwiseNone.- y
float, optional The spatial y-value point, in canonical crs units, of the POI. Defaults to
0if unspecified and x has been provided, otherwiseNone.- crs
CRSLike, optional The Coordinate Reference System of the POI. May be anything accepted by
pyproj.crs.CRS.from_user_input(). Defaults toEPSG:4326i.e.,WGS 84.
- x
Notes
Added in version 0.5.0.
Examples
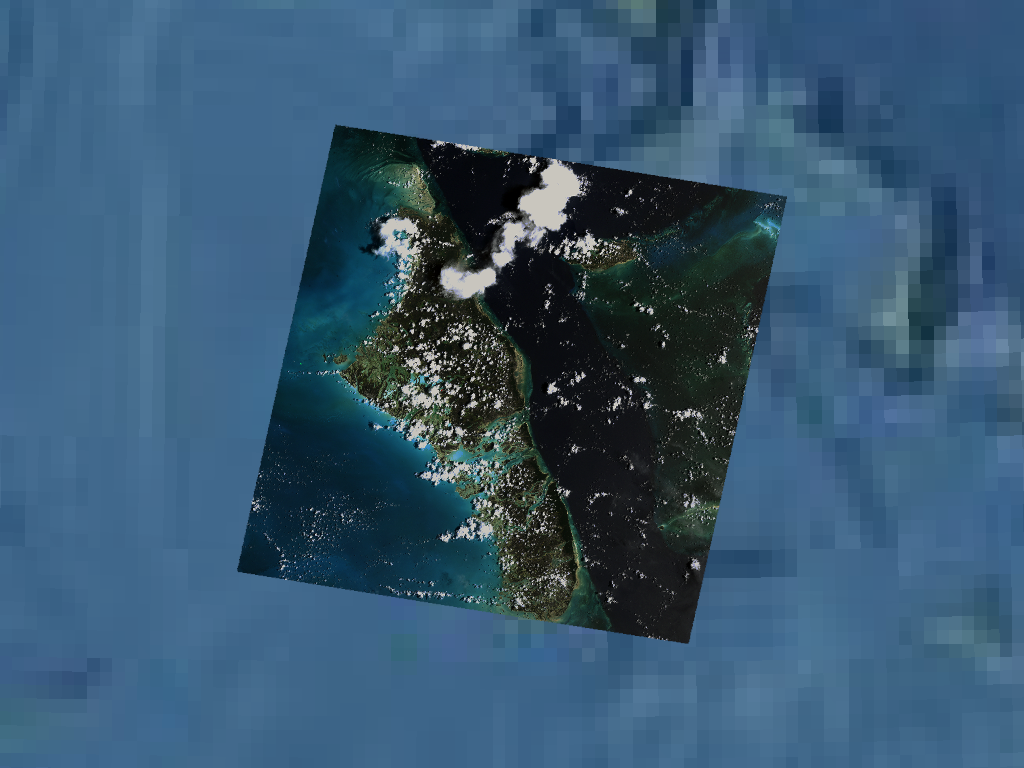
First, create an RGB mesh of the Bahamas from a GeoTIFF.
>>> import geovista
>>> from geovista.pantry import fetch_raster
>>> fname = fetch_raster("bahamas_rgb.tif")
>>> bahamas = geovista.Transform.from_tiff(
...     fname, rgb=True, sieve=True, extract=True
... )
Now add the
bahamasmesh to aplotterbefore adding a texture mapped base layer. Note that the camera is centered over thebahamasmesh, which is the primary focus of the scene.>>> p = geovista.GeoPlotter() >>> _ = p.add_mesh(bahamas, rgb=True) >>> p.view_poi() >>> _ = p.add_base_layer(texture=geovista.natural_earth_1()) >>> p.show()
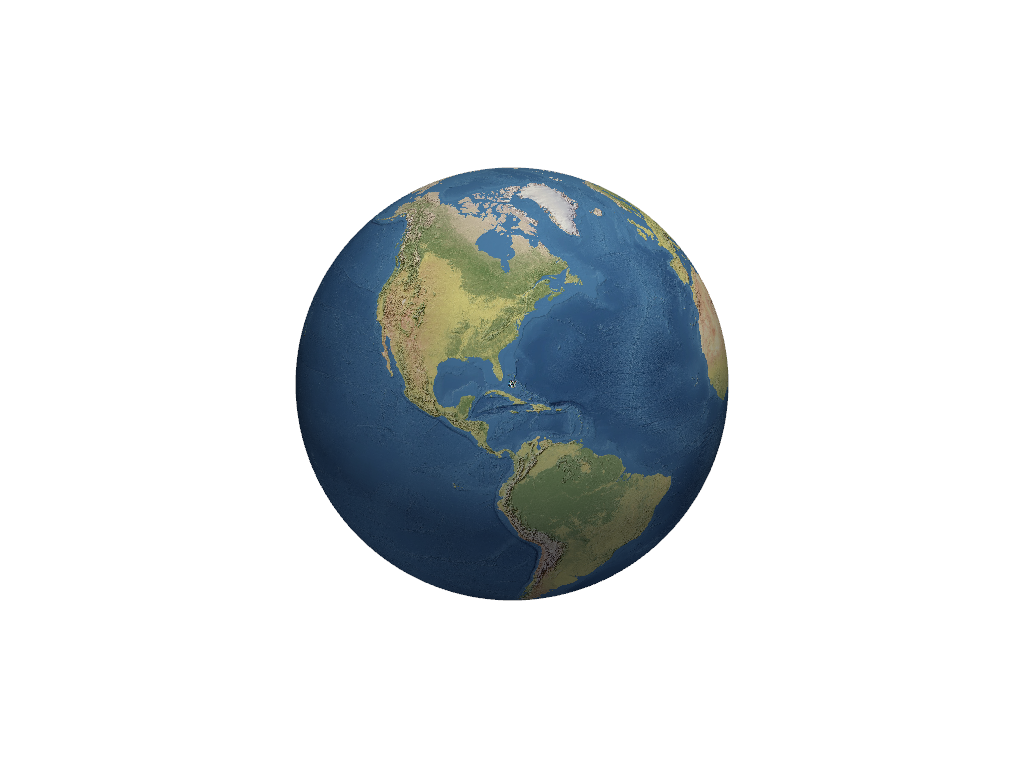
In comparison, add a texture mapped base layer to a
plotterbefore thebahamasmesh. The camera is still centered over thebahamasin the rendered scene, however the base layer is now fully visible.>>> p = geovista.GeoPlotter() >>> _ = p.add_base_layer(texture=geovista.natural_earth_1()) >>> _ = p.add_mesh(bahamas, rgb=True) >>> p.view_poi() >>> p.show()
- crs#
The Coordinate Reference System (CRS) for the plotter.
- property manifold: geovista.geodesic.BBox | None#
The manifold boundary applied to meshes added to the plotter.
Notes
Added in version 0.6.0.
- geovista.geoplotter.ADD_POINTS_STYLE: tuple[str, str] = ('points', 'points_gaussian')#
The valid ‘style’ options for adding points.
- geovista.geoplotter.BASE_ZLEVEL_SCALE: float = 0.001#
Proportional multiplier for z-axis levels/offsets of base-layer mesh.
- geovista.geoplotter.COASTLINES_RTOL: float = 1e-08#
Coastlines relative tolerance for longitudes close to ‘wrap meridian’.
- geovista.geoplotter.GRATICULE_SHOW_LABELS: bool = True#
Whether to render graticule labels by default.
- geovista.geoplotter.OPACITY_BLACKLIST = [('llvmpipe (LLVM 7.0, 256 bits)', '3.3 (Core Profile) Mesa 18.3.4')]#
Known GPU renderer and version combinations that don’t support opacity.