Examples#
Note
The Interactive Scene vtk.js backend does not support rendering text or points as spheres.
This interactive gallery highlights the growing capabilities and
features of geovista.
It is generated from the geovista.examples, which can also
be run from the command line:
$ geovista examples --all --verbose
Hint
Want to know more?
$ geovista examples --help
Contour#
Showcases various contouring examples.
Attention
There is an open pyvista issue
regarding contour_banded() rendering using the
trame framework within a browser interactive
scene. See #7145.

Curvilinear#
Demonstrates support for 2D curvilinear grid surfaces.
Domain#
Highlights various science domain specific examples.


Extraction#
Highlights various region manifold extraction techniques.


Grid#
A collection of examples demonstrating the visualization of various gridded volumes from different atmospheric models.
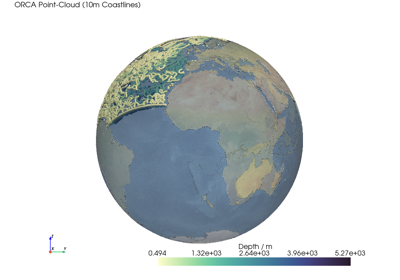
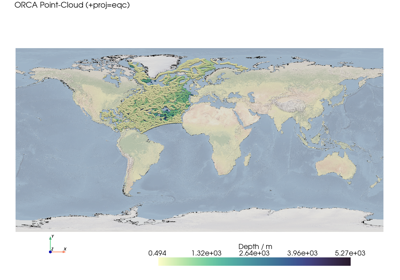
Point Cloud#
Examples of 3D cartographic point clouds.
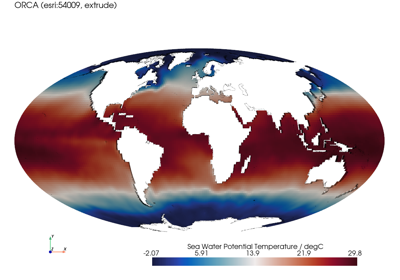
Rectilinear#
Demonstrates support for traditional 2D rectilinear grid surfaces.
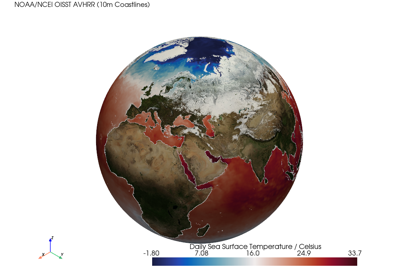
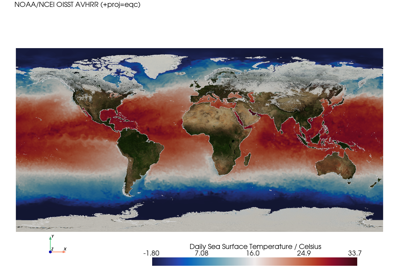
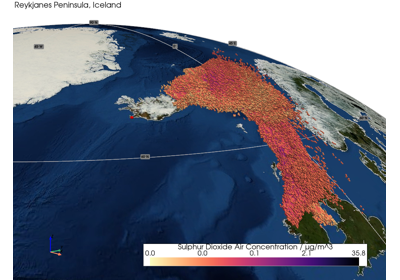
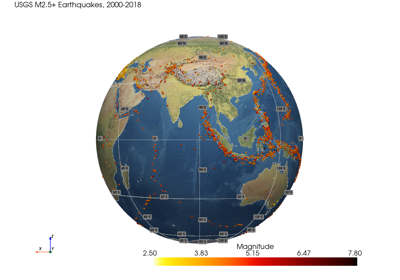
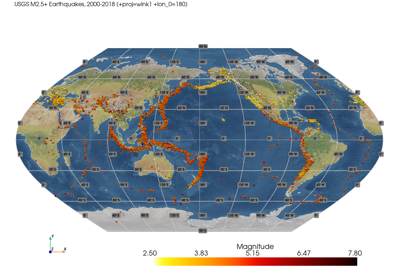
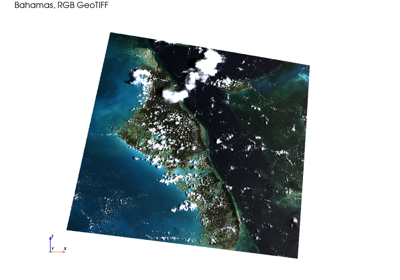
Scalar Data#
Examples of various scalar data visualization techniques.
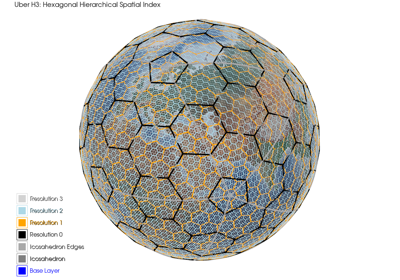
Spatial Index#
Demonstrates visualization of Discrete Global Grid Systems (DGGS) and spatial indexing techniques.
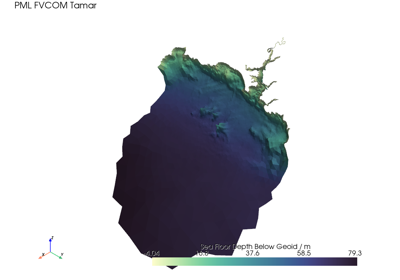
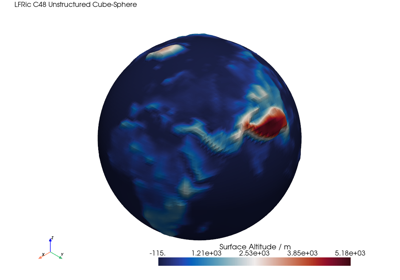
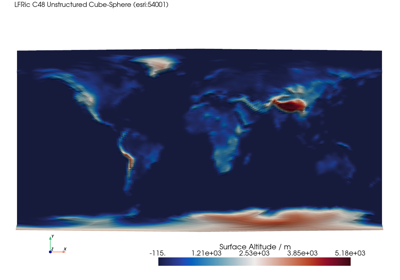
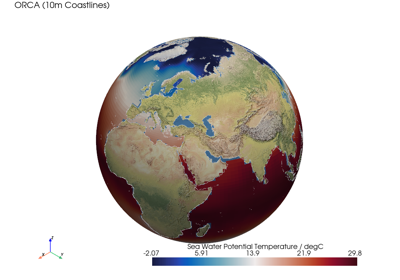
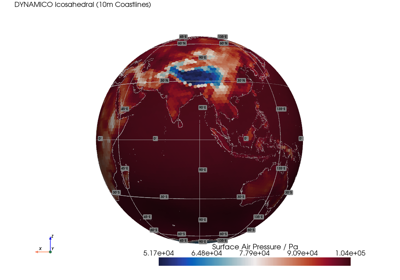
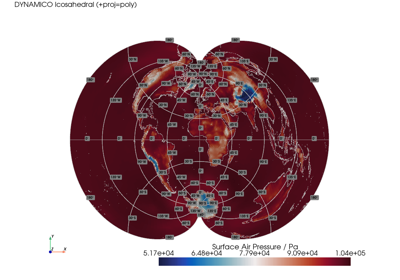
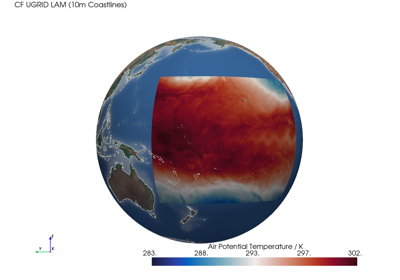
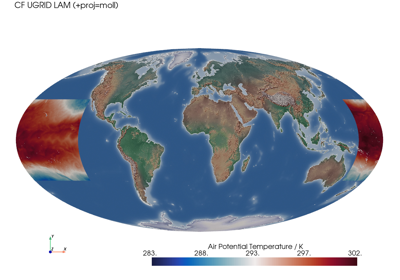
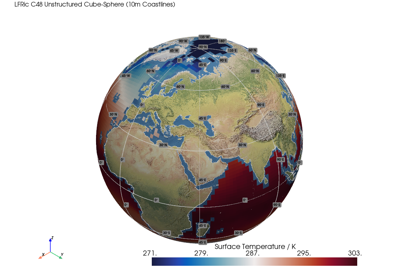
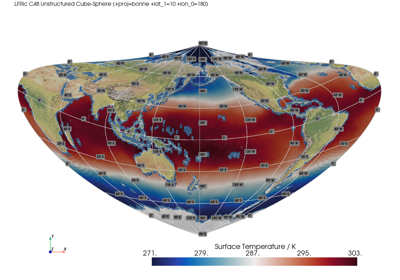
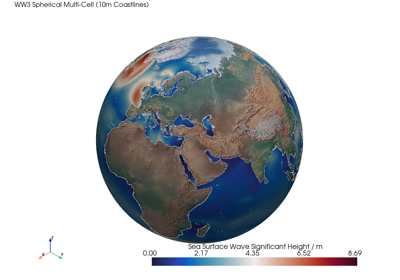
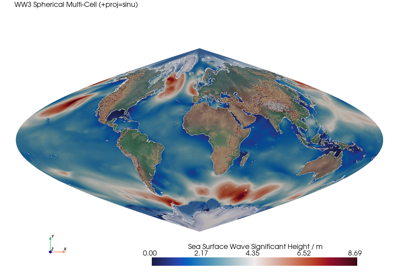
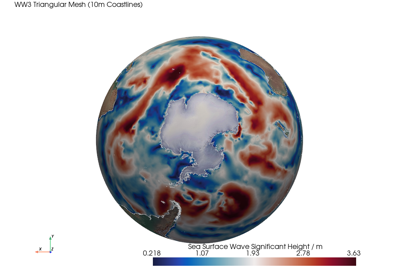
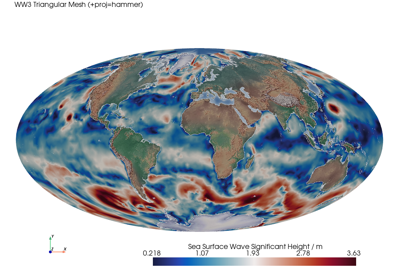
Unstructured#
A collection of examples demonstrating the visualization of unstructured mesh surfaces from various atmospheric and oceanographic models.
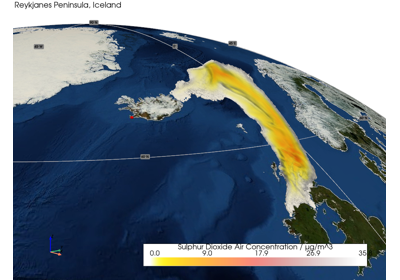
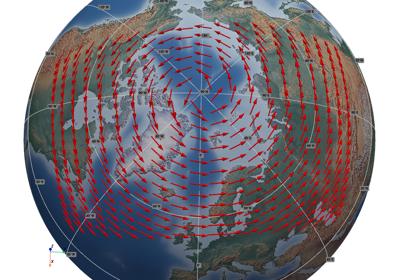
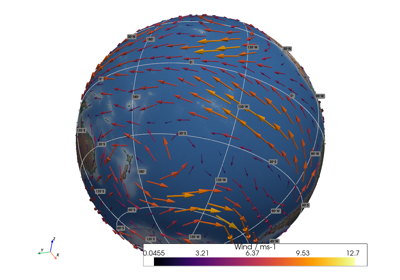
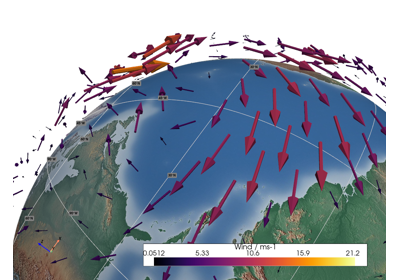
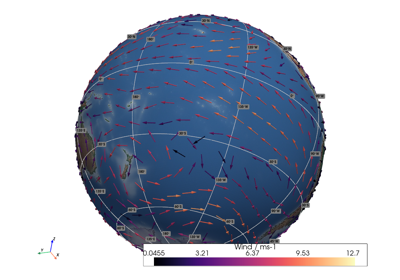
Vector Data#
Examples of wind vector data.
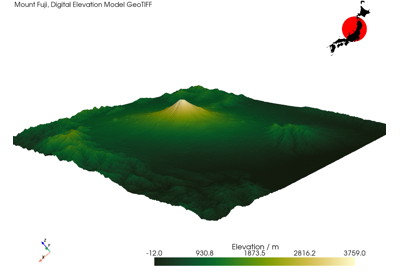
Warp#
Manipulation of mesh surfaces to reveal surface bathymetry and topography.