
注釈
Go to the end to download the full example code.
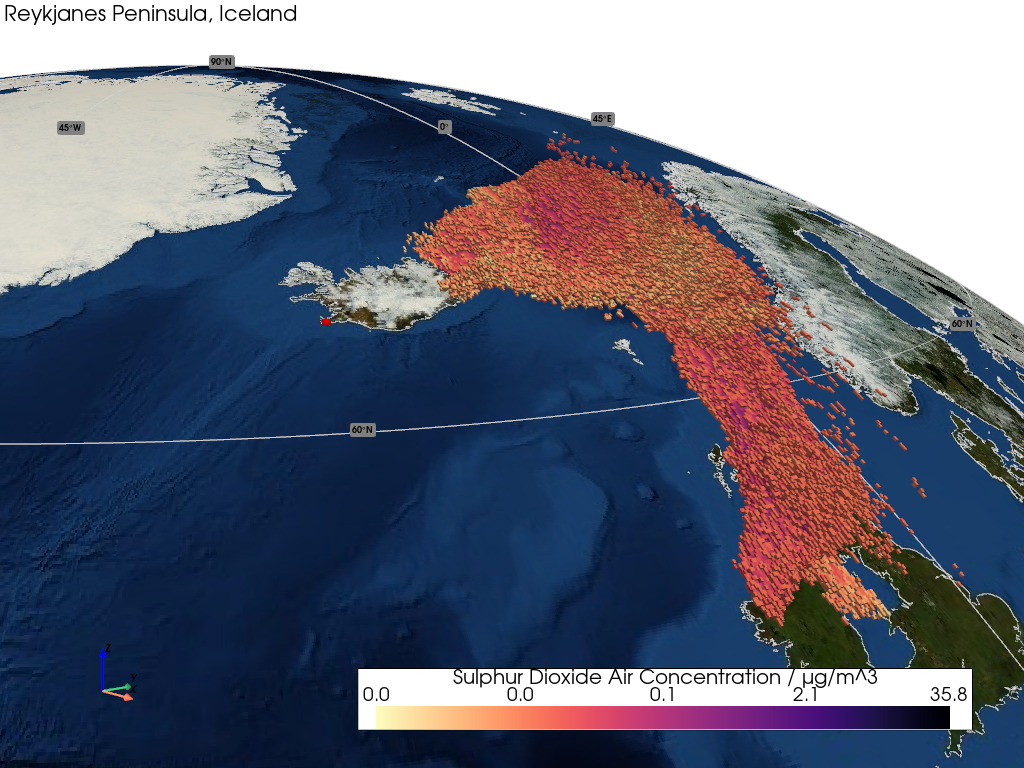
Reykjanes Plume#
This example demonstrates how to render a 3D structured grid.
📋 まとめ#
The sample data is taken from a Met Office NAME Model time-series simulation of the Icelandic Reykjanes Peninsula eruption on 29 May 2024.
A structured grid of cubic voxels is constructed for the 1D spatial coordinates and then thresholded to reveal the underlying volcanic plume of Sulphur Dioxide Air Concentration.
The visualization is enhanced by rendering with a log scale colormap due to the relatively large dynamic range and non-symmetric, skewed distribution of concentration levels within the plume.
The cited release location of the eruption on the peninsula is marked, highlighting the volcanic plume's eastward transport and southerly dispersion.
警告
Structured grid projection transformation support is pending.
from __future__ import annotations

import pyvista as pv

import geovista as gv
from geovista.pantry.data import name_reykjanes


def main() -> None:
    """Plot the volcanic plume structured grid.

    Notes
    -----
    .. versionadded:: 0.6.0

    """
    # Load the sample data.
    sample = name_reykjanes()

    # Create the structured grid.
    grid = gv.Transform.to_structured_grid(
        sample.xs,
        sample.ys,
        sample.zs,
        data=sample.data,
    )

    # Remove cells from the grid with NaN values then calculate the data range.
    grid = grid.threshold()
    clim = grid.get_data_range()

    # Now render the plotter scene.
    p = gv.GeoPlotter()
    p.add_base_layer(texture=gv.blue_marble(), zlevel=0)
    p.add_coastlines()
    p.add_graticule()
    sargs = {"title": f"{sample.name} / {sample.units}", "fmt": "%.1f"}
    p.add_mesh(
        grid,
        clim=clim,
        cmap="magma_r",
        log_scale=True,
        scalar_bar_args=sargs,
    )
    p.add_text(
        "Reykjanes Peninsula, Iceland",
        position="upper_left",
        font_size=10,
    )

    # Mark the event release location.
    p.add_points(
        xs=sample.poi.longitude,
        ys=sample.poi.latitude,
        render_points_as_spheres=True,
        color="red",
        point_size=10,
    )

    # Define a specific camera position and orientation.
    cpos = pv.CameraPosition(
        position=(0.8957959335673299, -0.47394138433018956, 0.9968046553672109),
        focal_point=(-0.10638261870474444, 0.3538637910944052, 0.715402511958916),
        viewup=(-0.17014498616109472, 0.12623579798398435, 0.977299957531764),
    )

    p.add_axes()
    p.show(cpos=cpos)


if __name__ == "__main__":
    main()