
概要#
ここでは、 geovista のハイレベルな概要を説明します。
その目標と動機について簡単に説明し、進化する能力を支える豊かで強力なエコシステムについて紹介します。
Motivation#
geovista is a pure Python package that offers performant,
publication quality 3D cartographic rendering of Earth Science data.
Its goal is to lower the bar for scientists, such that they can easily analyze, visualize, and explore their rectilinear, curvilinear and unstructured geospatial data interactively in 3D, whilst also supporting traditional 2D static plots, cartographic projections and coordinate transformations.
私たちの意図は、geovista が PyVista のパワフルな世界、そしてそれが提供するすべてのものへの地図上のゲートウェイとなることです。 GPUのパワーを活用した応答性の高い可視化ツールチェーンを通して、科学者がデータを再発見するための扉を開くのです。
端的に言えば、
"PyVista にとっての GeoVista" は、 "Matplotlib にとっての Cartopy"
それが私たちの目標です。
geovista は Cartopy と同様に、Scientific Python コミュニティに対して可能な限り柔軟でオープンなものでありたいと考えています。 つまり、 geovista は geopandas 、 iris 、 xarray などの空間データを可視化するための準備に特化したパッケージとは無関係であり続けます。
Ecosystem#
geovista は、 PyVista とVisualization Toolkit (VTK)という巨人の肩の上に構築されているため、GPUのパワーを簡単に活用することができます。
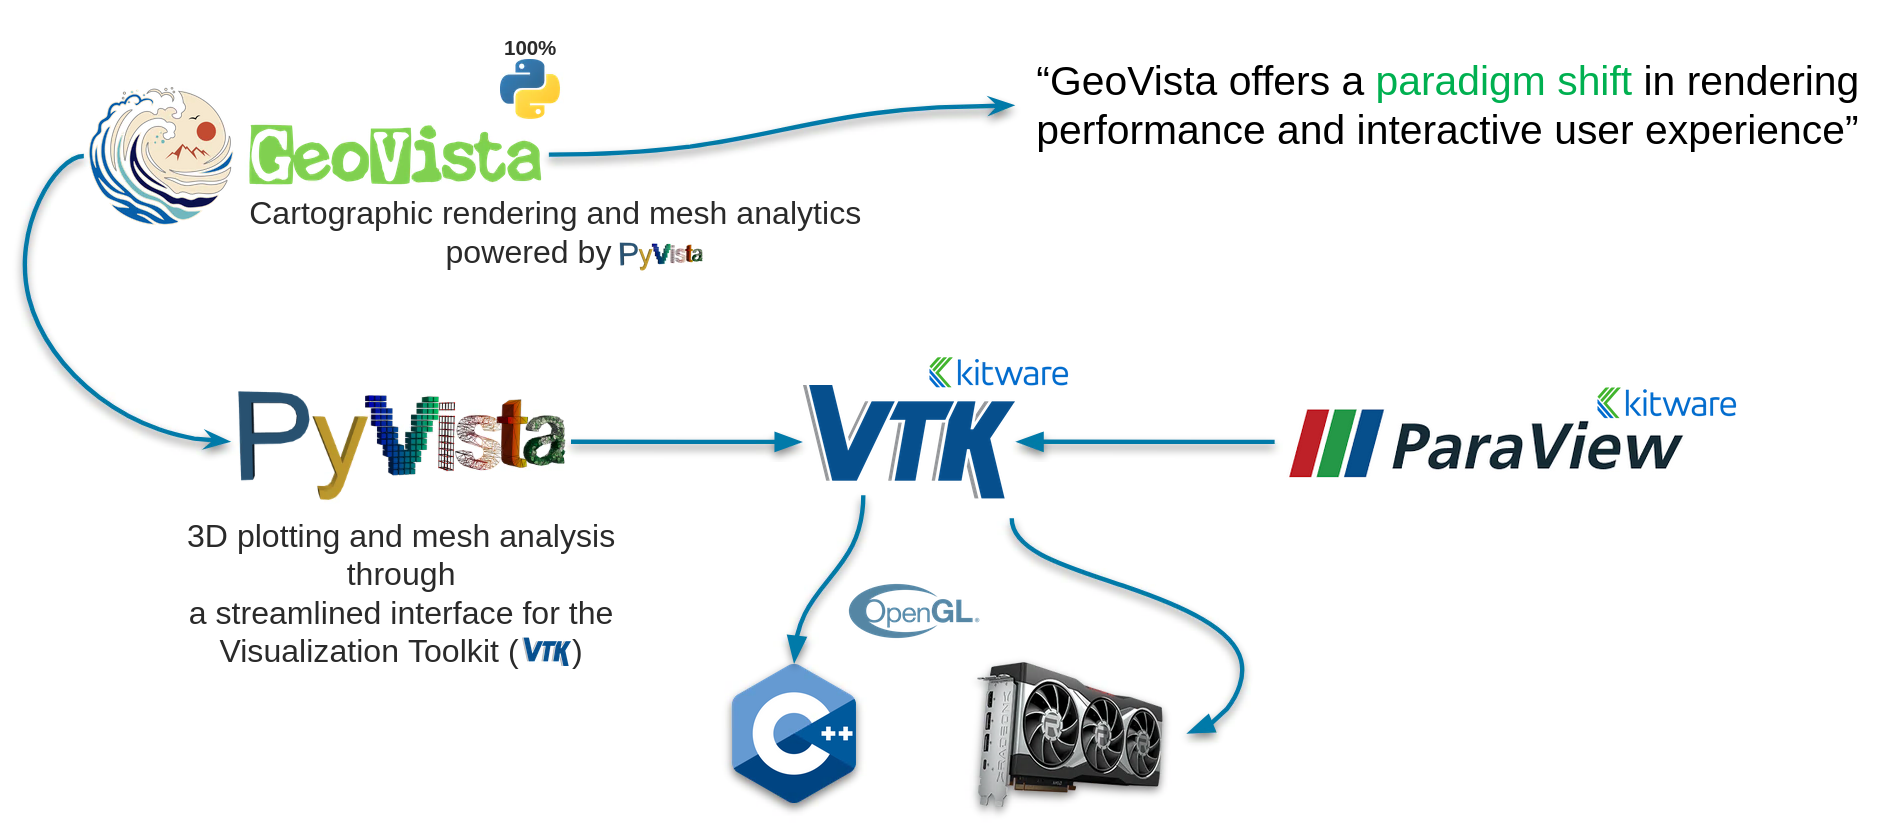
Fig. 1: geovista のエコシステム#
上に示したように、 geovista は、 ``Kitware`_ とオープンソースコミュニティによってサポートされ、保守されている、性能が高く、機能が豊富な VTK ツールチェインに基づいて構築されています。
このツールチェーンは、直感的なPythonicインターフェイスを通して VTK の強力な可視化バックエンドを公開する PyVista によって実現されます。
PyVista in a Nutshell#
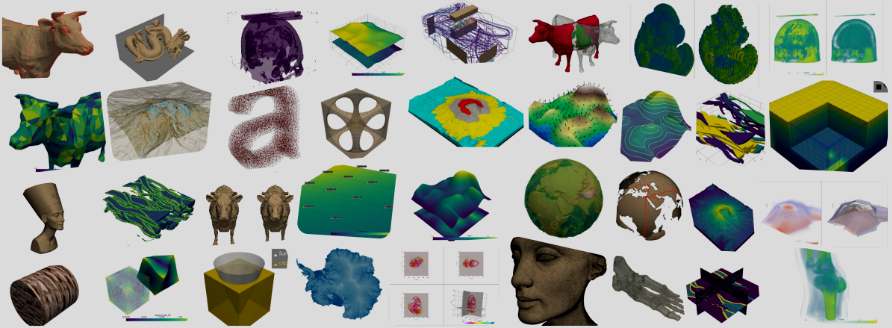
Fig. 2: PyVista の例#
PyVista is a powerful open-source 3D visualization library built on VTK, providing:
Development Status#
geovista はまだ日が浅いですが、地球科学コミュニティに提供できる可能性と将来性にすでに興奮しています。
Our primary focus at the moment is to provide a stable API and core set of features ... we're working hard on that, but we're not there yet!
お待たせしております🙏