
注釈
Go to the end to download the full example code.
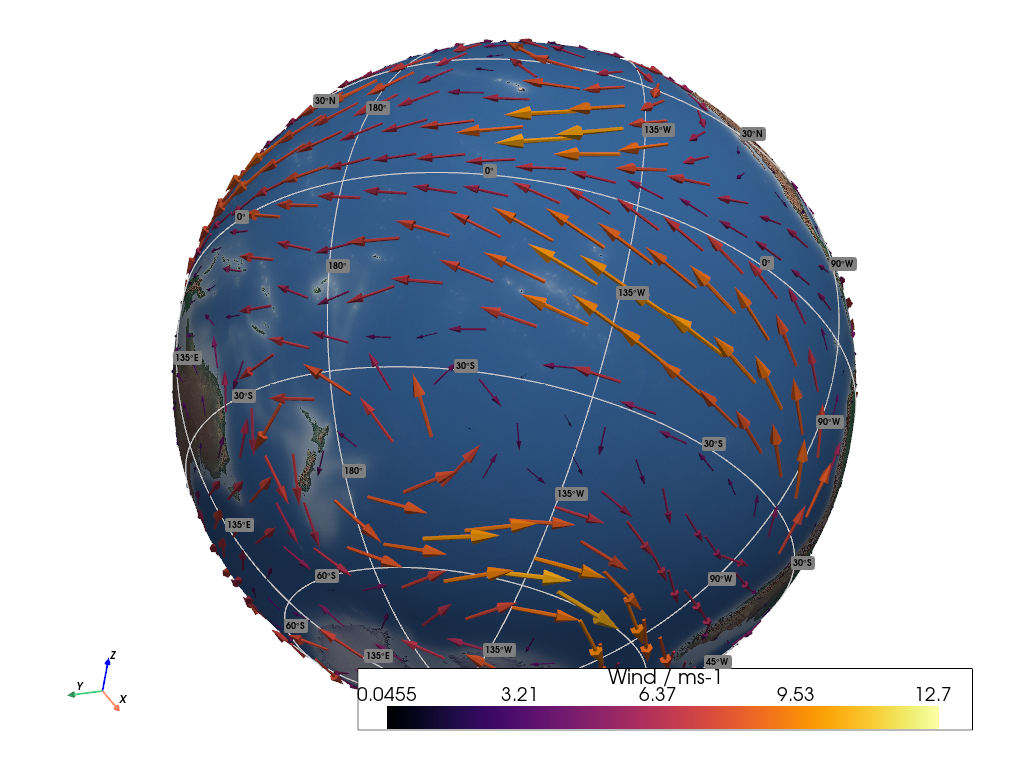
Wind Arrows#
This example demonstrates how to render scaled horizontal wind arrows.
📋 まとめ#
The sample data contains a longitude and latitude point cloud, along with sample
winds provided in the form of three separate eastward (U), northward (V),
and upward (W) vector components.
The vector components are measured relative to each spatial sample point in the point cloud.
No connectivity is provided within the sample data, so each point is a
separate location in a field of scattered points, and each point has an
associated wind vector independent of the others. We use the
geovista.bridge.Transform.from_points() method, passing the winds with
the vectors keyword, along with the associated sample points to generate
a point cloud mesh with attached vectors.
The wind arrows are generated from this point cloud mesh via the
pyvista.DataSetFilters.glyph() method, which scales each arrow in size and
colour relative to the magnitude of its associated wind vector.
Note that, we only use the horizontal winds (U and V) in this example,
which is the most common use case.
参考
Wind Arrows Flow for an example of rendering fixed-length horizontal wind arrows.
from __future__ import annotations

import pyvista as pv

import geovista as gv
from geovista.pantry.data import lfric_winds


def main() -> None:
    """Plot scaled horizontal wind arrows (UV).

    Notes
    -----
    .. versionadded:: 0.6.0

    """
    # Load the sample data.
    sample = lfric_winds()

    # Create the point cloud mesh with attached horizontal wind vectors
    # from the sample eastward (u) and northward (v) components.
    mesh = gv.Transform.from_points(
        sample.lons,
        sample.lats,
        vectors=(sample.u, sample.v),
    )

    # Generate a mesh containing arrow glyphs from the wind vectors. Apply an
    # overall scaling factor to make the arrows a reasonable size, and colour
    # the arrows relative to their associated vector magnitude.
    arrows = mesh.glyph(factor=0.02, color_mode="vector")

    # Now render the plotter scene.
    p = gv.GeoPlotter()
    sargs = {"title": f"{sample.name} / {sample.units}"}
    p.add_mesh(arrows, cmap="inferno", scalar_bar_args=sargs)
    p.add_base_layer(texture=gv.natural_earth_hypsometric())
    p.add_graticule()

    # Define a specific camera position and orientation.
    cpos = pv.CameraPosition(
        position=(-4.06882, -2.54626, -2.85930),
        focal_point=(-0.00378, 0.00517, -0.00317),
        viewup=(-0.52338, -0.11175, 0.84474),
    )
    p.camera.zoom(1.3)

    p.add_axes()
    p.show(cpos=cpos)


if __name__ == "__main__":
    main()