
注釈
Go to the end to download the full example code.
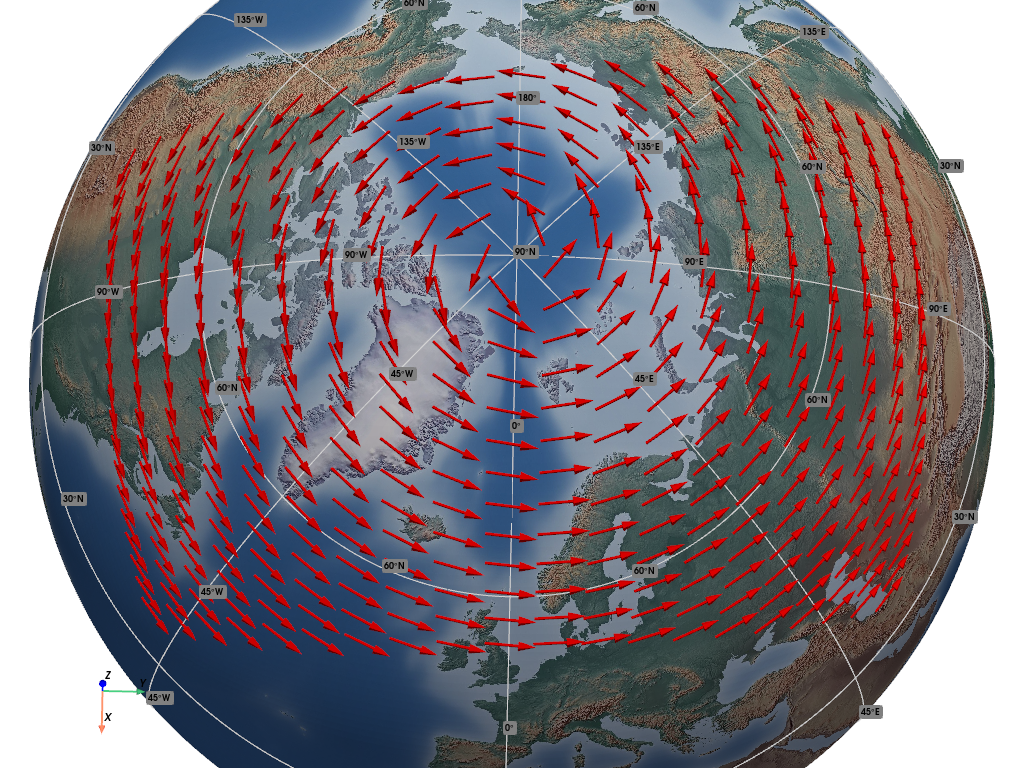
True Winds (Foreign Grid)#
This example demonstrates how to render "true" winds, when attached to data points given in a non-standard Coordinate Reference System (CRS).
📋 まとめ#
The example constructs sample points on a North Polar Stereographic grid, and assigns
synthetic vector values to them, representing wind data. These data are presented as
"true" winds, i.e., eastward (U) and northward (V) vector components, therefore
not related to the foreign sample points grid. This is a fairly typical real world
use case.
A synthetic eastward wind with a constant 4.0 ms-1 is generated everywhere,
so the final effect is clearly visible.
We use the geovista.bridge.Transform.from_points() method, passing the
winds to the vectors keyword, and specifying the different CRS of both the
sample points (crs) and the vectors (vectors_crs).
from __future__ import annotations

import cartopy.crs as ccrs
import numpy as np
import pyvista as pv

import geovista as gv


def main() -> None:
    """Plot vectors on different CRS from points.

    Notes
    -----
    .. versionadded:: 0.6.0

    """
    # Create a stereographic CRS (foreign grid) for the sample points.
    crs_polar = ccrs.NorthPolarStereo()

    # Create a geographic (latitude/longitude) CRS for the vectors.
    crs_latlon = ccrs.Geodetic()

    # Create the polar grid points.
    x = np.linspace(-5.0e6, 5.0e6, 20)
    y = np.linspace(-4.0e6, 2.0e6, 20)
    xs, ys = np.meshgrid(x, y)

    # Create the eastward (us) and northward (vs) wind vector components.
    xs, ys = xs.flatten(), ys.flatten()
    us, vs = 4.0 * np.ones_like(xs), np.zeros_like(ys)

    # Create the point cloud mesh with attached wind vectors.
    mesh = gv.Transform.from_points(
        xs, ys, vectors=(us, vs), crs=crs_polar, vectors_crs=crs_latlon
    )

    # Generate a mesh containing arrow glyphs from the wind vectors.
    arrows = mesh.glyph(factor=0.02)

    # Now render the plotter scene.
    p = gv.GeoPlotter()
    p.add_mesh(arrows, color="red")
    p.add_base_layer(texture=gv.natural_earth_hypsometric())
    p.add_graticule()

    # Define a specific camera position and orientation.
    cpos = pv.CameraPosition(
        position=(0.60371, -0.01103, 3.06958),
        focal_point=(0.0, 0.0, 0.00289),
        viewup=(-0.98099, -0.01998, 0.19304),
    )

    p.add_axes()
    p.show(cpos=cpos)


if __name__ == "__main__":
    main()