
注釈
サンプルコードを全てダウンロードするには 末尾に移動 。
地震#
この例では、スカラーポイントをレンダリングする方法を示します。
📋 まとめ#
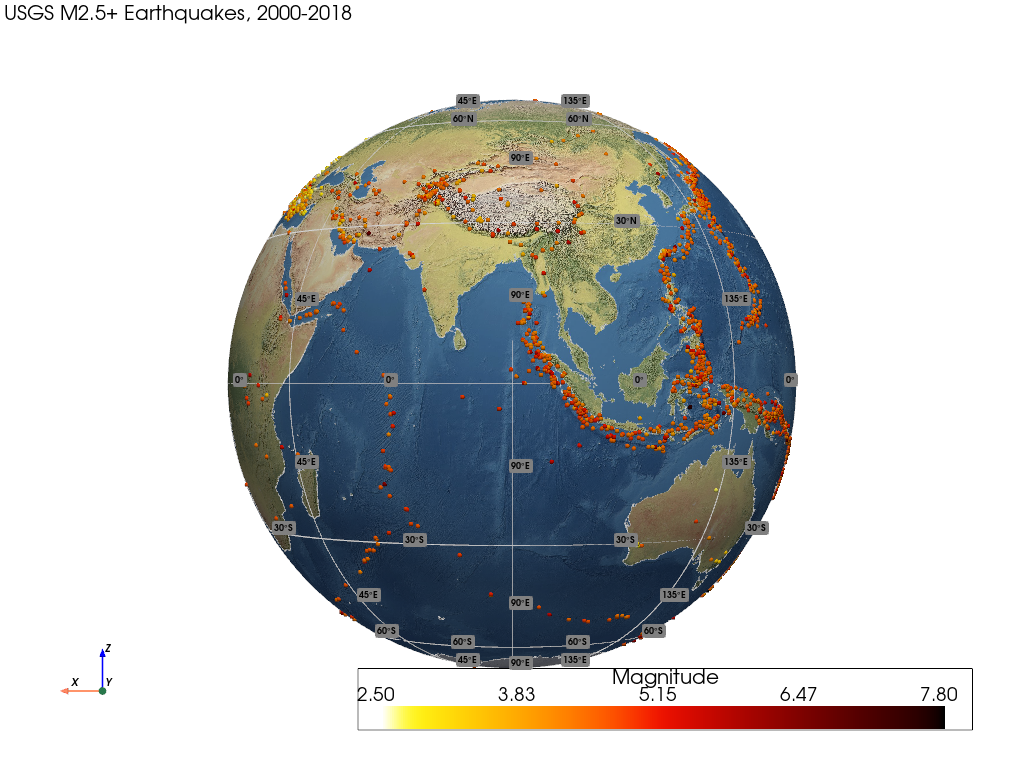
USGS地震データセットから点群を作成します。
レンダリング結果には、M2.5以上の地震の点群に加え、Natural EarthのベースレイヤーとNatural Earthの海岸線が含まれています。
地震データセットは USGS Earthquake Hazards Program から提供され、この HoloViz Tutorial の一部として 前処理 されたものです。
マグニチュード |
地震の影響 |
年間推定数 |
|---|---|---|
<=2.5 |
通常は感じないが、地震計で記録することができます。 |
無数 |
2.5 - 5.4 |
しばしば感じられるが、ダメージは軽微。 |
500,000 |
5.5 - 6.0 |
建物やその他の構造物にわずかな損傷。 |
350 |
6.1 - 6.9 |
人口密集地では大きな被害をもたらすかもしれません。 |
100 |
7.0 - 7.9 |
大地震。 深刻な被害。 |
10-15 |
>=8.0 |
大地震。 震源地近くのコミュニティを破壊する可能性があります。 |
1年か2年に1回 |
詳細は 参考文献 を参照。
注意
Optional package dependencies pandas and fastparquet are required.
from __future__ import annotations

import geovista as gv
from geovista.pantry.data import usgs_earthquakes


def main() -> None:
    """Plot points-of-interest for USGS earthquakes.

    Notes
    -----
    .. versionadded:: 0.4.0

    """
    # Load sample data, which requires the optional package
    # dependencies 'fastparquet' and 'pandas'.
    sample = usgs_earthquakes()

    # Plot the points.
    p = gv.GeoPlotter()
    sargs = {"title": "Magnitude"}
    p.add_points(
        xs=sample.lons,
        ys=sample.lats,
        cmap="fire_r",
        render_points_as_spheres=True,
        scalars=sample.data,
        point_size=5,
        scalar_bar_args=sargs,
    )
    # Force zlevel alignment of coastlines and base layer.
    p.add_base_layer(texture=gv.natural_earth_1(), zlevel=0)
    p.add_graticule()
    p.add_coastlines()
    p.add_text(
        "USGS M2.5+ Earthquakes, 2000-2018",
        position="upper_left",
        font_size=10,
    )

    # Define a specific camera position.
    p.view_xz(negative=True)
    p.camera.zoom(1.3)

    p.add_axes()
    p.show()


if __name__ == "__main__":
    main()