例#
注釈
Interactive Scene vtk.js は、テキストやポイントを球体としてレンダリングすることをサポートして いません 。
このインタラクティブなギャラリーは、 geovista の拡張機能と特徴を紹介しています。
It is generated from the geovista.examples, which can also
be run from the command line:
$ geovista examples --all --verbose
ヒント
もっと知りたい?
$ geovista examples --help
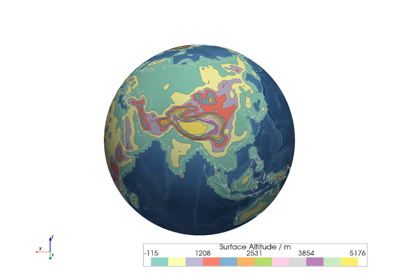
Contour#
Showcases various contouring examples.
注意
There is an open pyvista issue
regarding contour_banded() rendering using the
trame framework within a browser interactive
scene. See #7145.
Curvilinear#
Demonstrates support for 2D curvilinear grid surfaces.
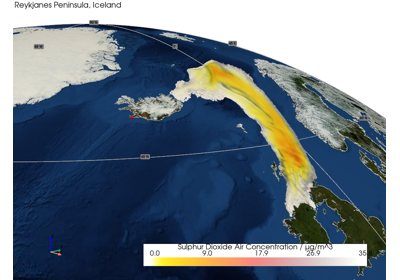
Domain#
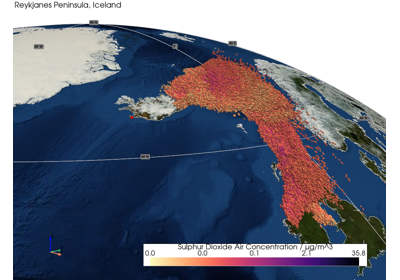
Highlights various science domain specific examples.
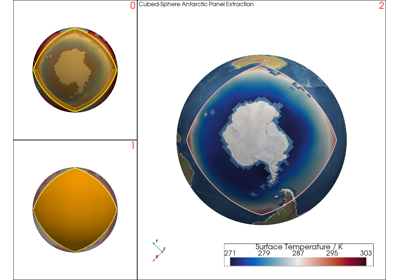
Extraction#
Highlights various region manifold extraction techniques.
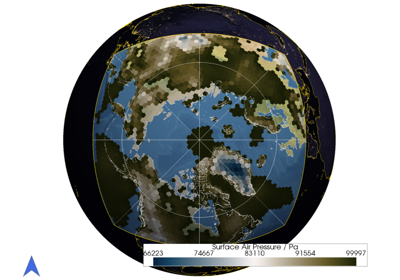
Grid#
A collection of examples demonstrating the visualization of various gridded volumes from different atmospheric models.
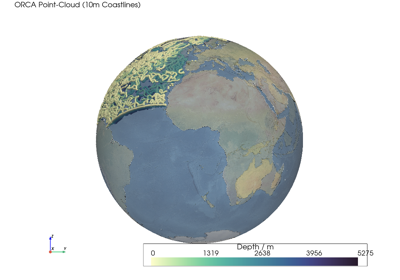
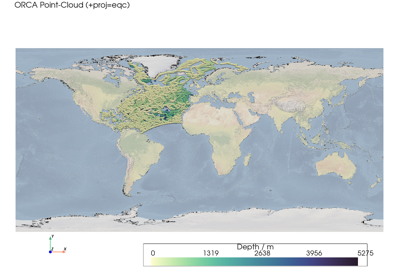
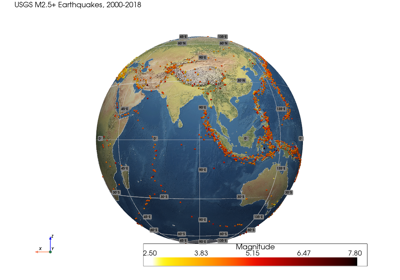
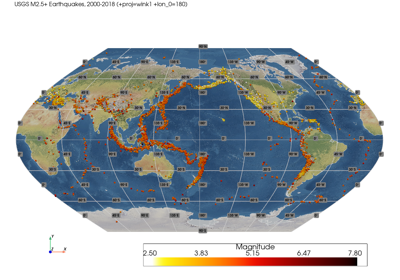
Point Cloud#
Examples of 3D cartographic point clouds.
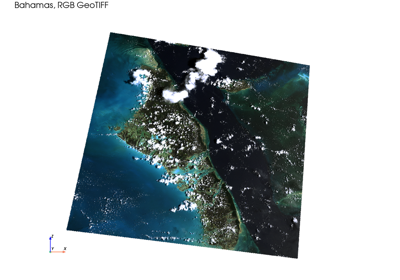
Rectilinear#
Demonstrates support for traditional 2D rectilinear grid surfaces.
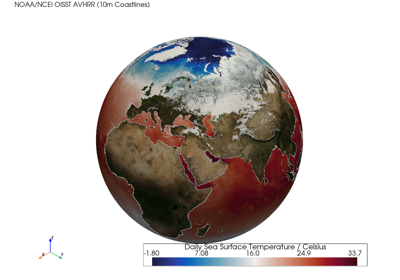
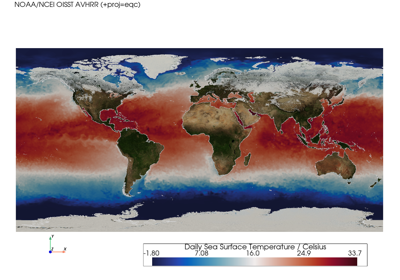
Scalar Data#
Examples of various scalar data visualization techniques.
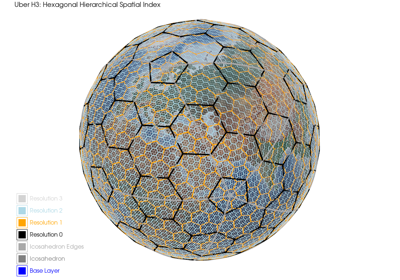
Spatial Index#
Demonstrates visualization of Discrete Global Grid Systems (DGGS) and spatial indexing techniques.
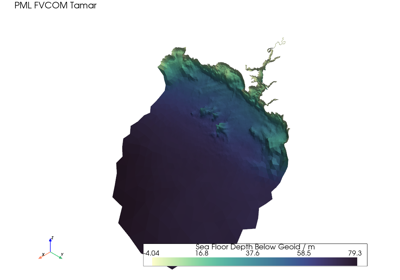
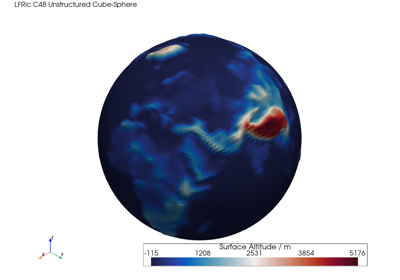
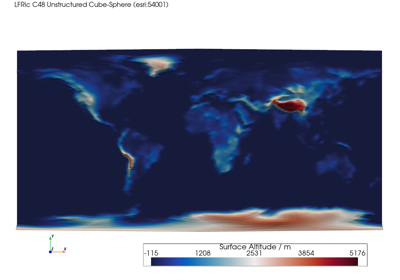
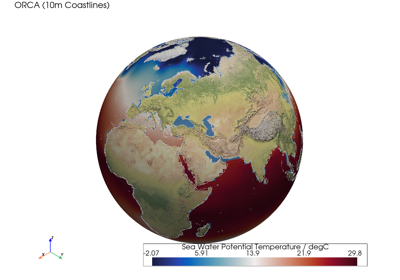
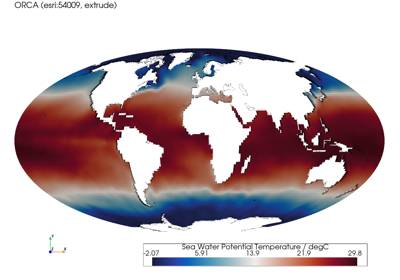
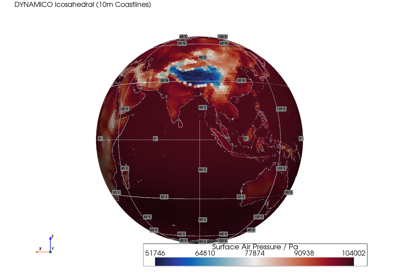
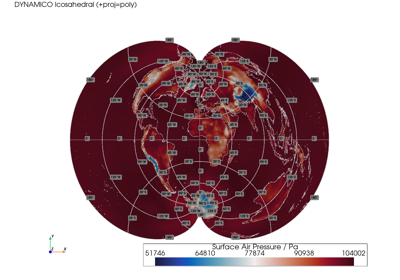
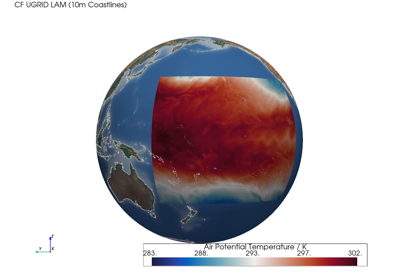
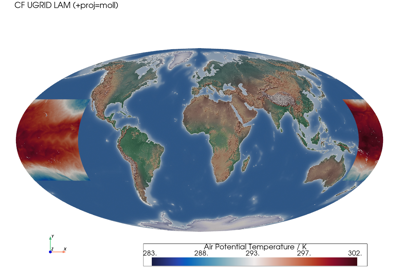
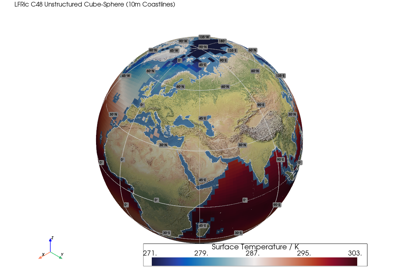
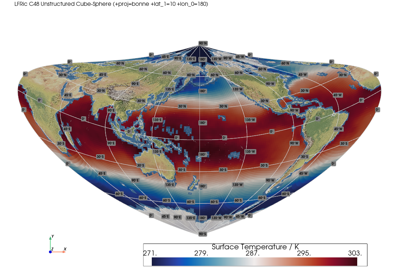
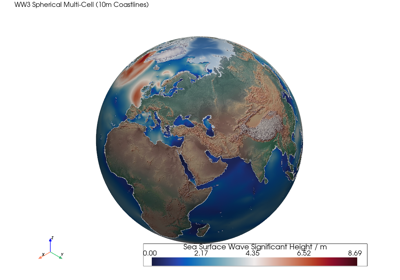
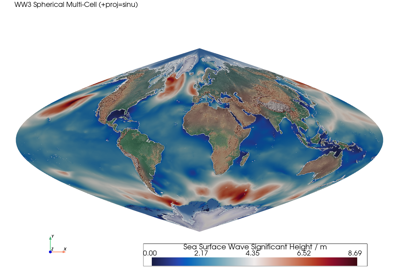
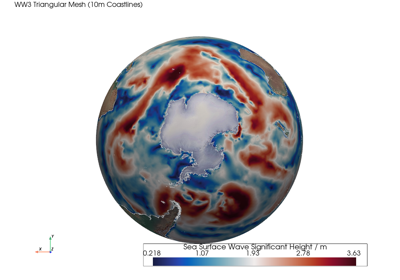
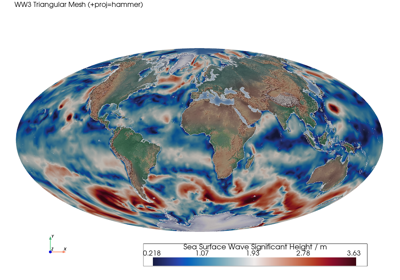
Unstructured#
A collection of examples demonstrating the visualization of unstructured mesh surfaces from various atmospheric and oceanographic models.
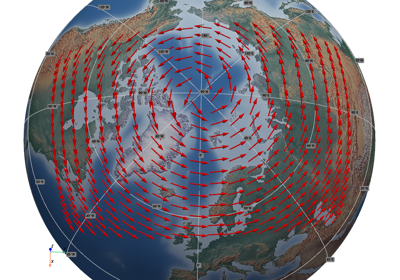
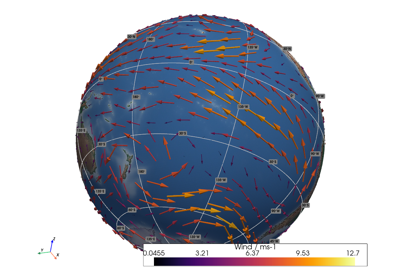
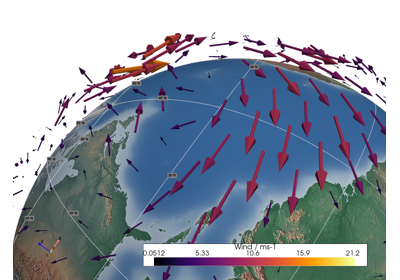
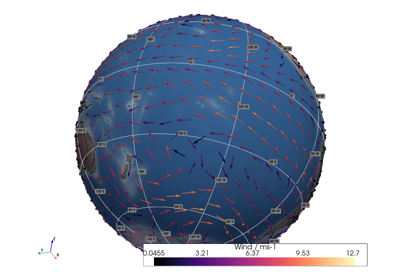
Vector Data#
Examples of wind vector data.
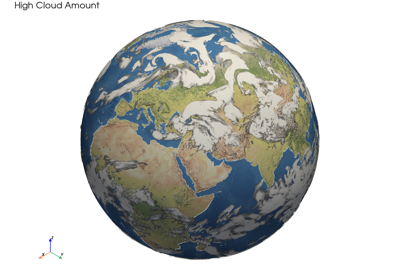
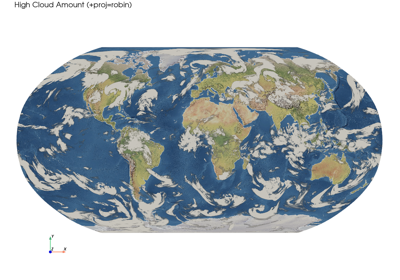
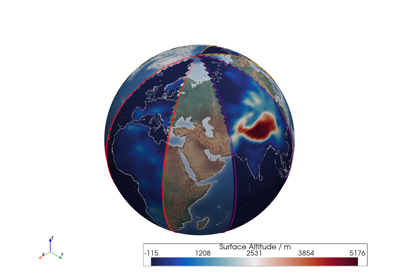
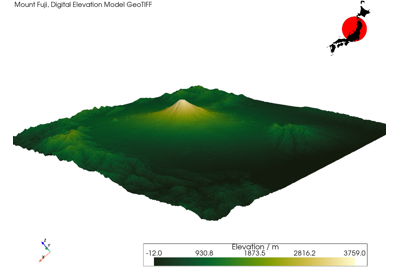
Warp#
Manipulation of mesh surfaces to reveal surface bathymetry and topography.